Avnav Overlays
Since version 20201219 AvNav is able to show additional information beside the chart itself in it's chart views. This could be waypoints from a GPX file or available tracks or other data (like e.g. current buoys from nautin.nl).
Additionally you can show multiple charts on top of each other (e.g. an OpenSeamap chart that covers a wider range below an o-charts chart - or just multiple o-charts for different ranges).
Within AvNav this is called Overlays.
You can use the following types of data for overlays:
- GPX files (waypoints, tracks, routes)
- KML and KMZ files (google) - inside the KMZ file you must have a doc.kml.
- geojson files
- other AvNav charts
- AvNav routes
- AvNav tracks
For GPX and KML files you can provide user defined icons or e.g. html pages that can be accessed via link properties within a zip archive. KMZ files normally already contain such kinds of data.
If you have such overlays visible on a chart you can obtain additional information by clicking on the symbol on the chart.
Configuration
Before you can start using overlays they need to be uploaded to AvNav.
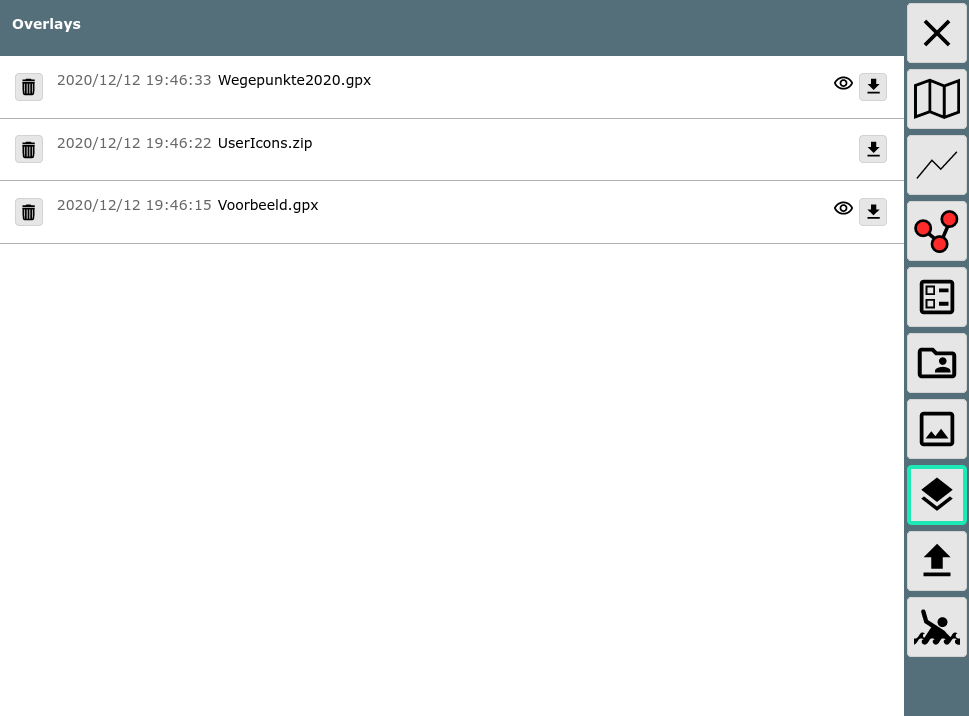
Within AvNav the symbol ![]() is used for overlays.
is used for overlays.
After you uploaded the files you can assign them to the available charts. You can define a set of overlays to be shown on every chart (default overlays). Additionally you can define per chart which overlays you would like to see on it.
You can make those assignments either on the Files/Download page at the sub section "charts" - or at the Mainpage.
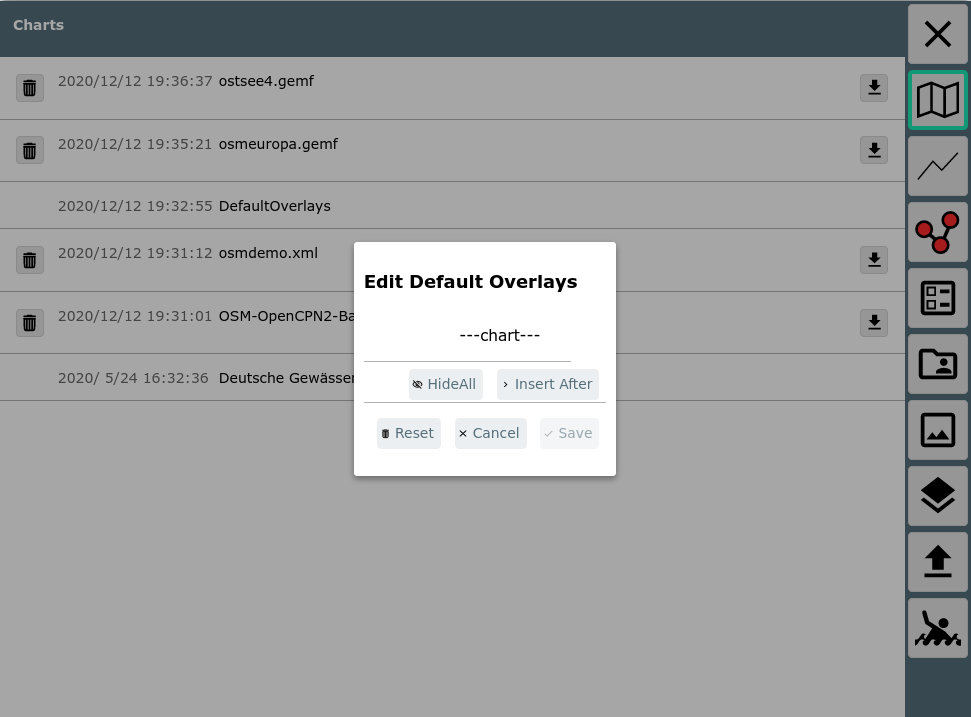
In the screenshot you see the dialog showing up once you click on
"DefaultOverlays" at the Files/Download page.
To change the display order of overlays just drag and drop them in the
list.
Hint: Overlays shown before the ---chart--- entry are shown below the
chart.
The overlays defined in the default overlays will be visible for all
charts (but can be enabled/disabled in the overlay dialogs for particular
charts).
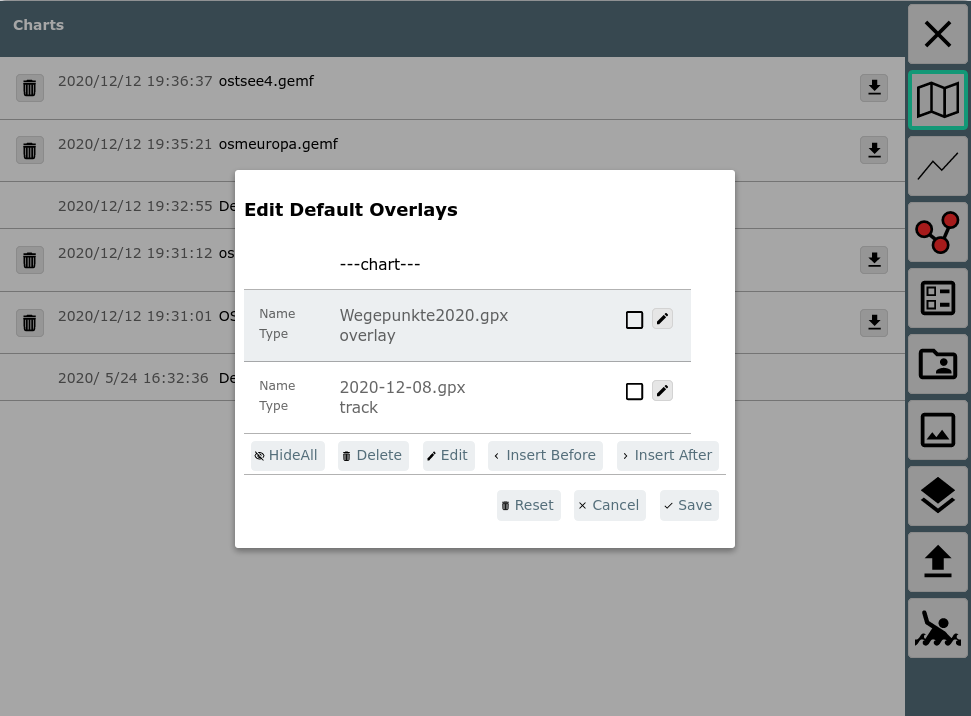
In this dialog you can add, edit or remove overlays.
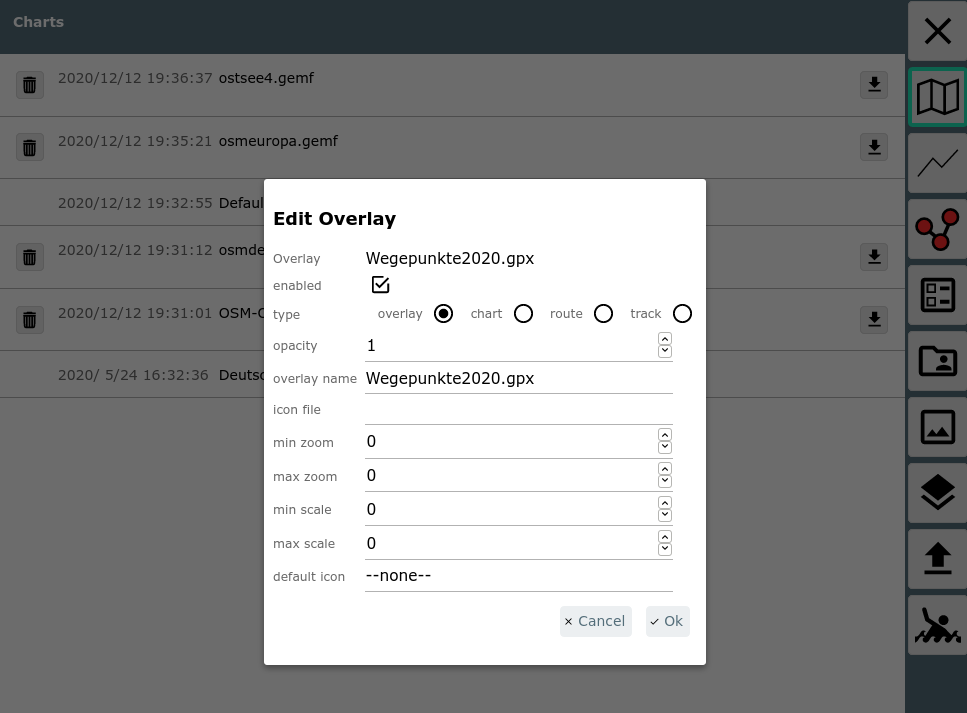
In the screenshot you see the dialog that opens on clicking
"InsertAfter".
In the example I selected the file Wegepunkte2020.gpx (NV
Verlag) that has been uploaded to the overlays directory.
You can now set various parameters (depending on the type of overlay).
| Name | default | Description |
| enable | true | If set to false the overlay is configured - but will still not show up. You can have it displayed later on by a single click. |
| type | overlay | type of overlay overlay: a file that has been uploaded to overlays chart: a chart from AvNav route: a route from AvNav track: a track from AvNav |
| overlay name | --- | you will get a list to select from available overlays depending on the selected type |
| opacity | 1 | the opacity for the display (0...1) - 0: invisible |
| icon file | --- | You can select a zip file (that has been uploaded to overlays)
containing symbol icons or other content (like html pages). If there is a "sym" property within a gpx file (e.g. at a waypoint) - like sym="b1" AvNav will try to read a file b1.png from the provided zip file to display it at the position. If a link property like link="data/1.html" is present, an entry data/1.html will be searched for within the zip file. The same applies for KML files. Normally however, you better use KMZ files as they already contain all necessary data. |
| min zoom | 0 | the minimal zoom level for displaying the overlay(0: always) |
| max zoom | 0 | the maximal zoom level for displaying the overlay(0: always) |
| min scale | 0 | if the zoom level of the chart is below this value, symbols will be scaled down (0: function disabled) |
| max scale | 0 | if the zoom level of the chart is above this value, symbols will be scaled up (0: function deactivated) |
| default icon | --none-- | With this parameter you can select an icon file (png, svg) to be
used if an icon is not found (or you did not fill the user icons
parameter). You can select from files you have uploaded to overlays
or to user files or to images. With --DefaultGpxIcon-- you can select a builtin icon. |
| show text | false | If enabled show item names (e.g. point names) |
| featureFormatter | --- | select a featureFormatter that will be used to format the information when the overlay is clicked on the map. |
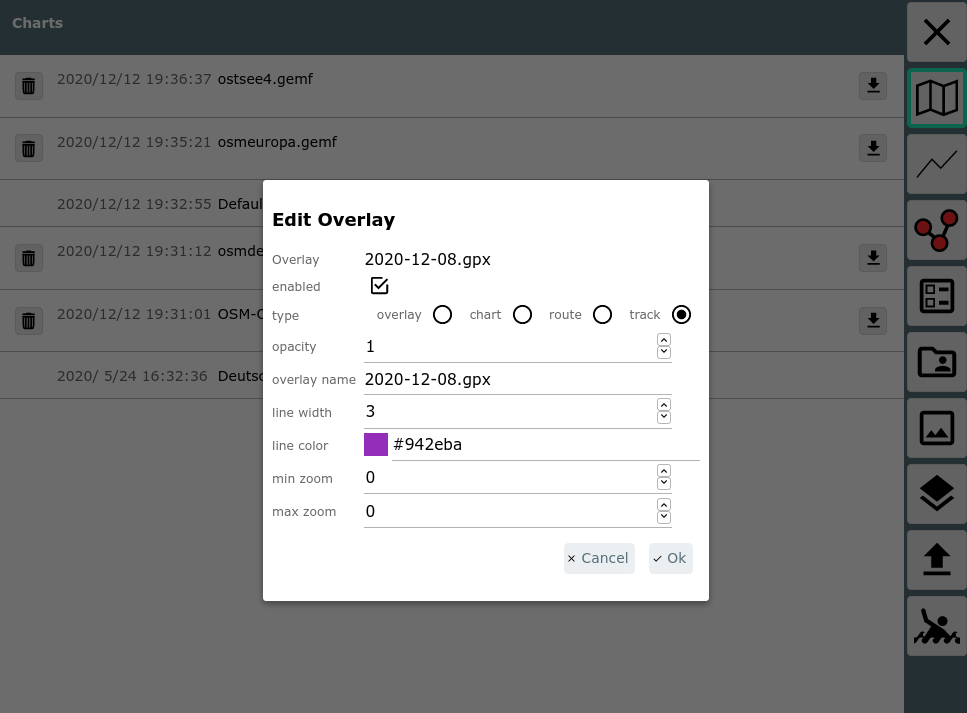
If the overlay contains other data than way points, potentially more parameters can be displayed.
| Name | default | Description |
| line width | track/route line width | line width for display |
| line color | track/route color | line color for display |
After clicking "Ok" the overlay has been added.
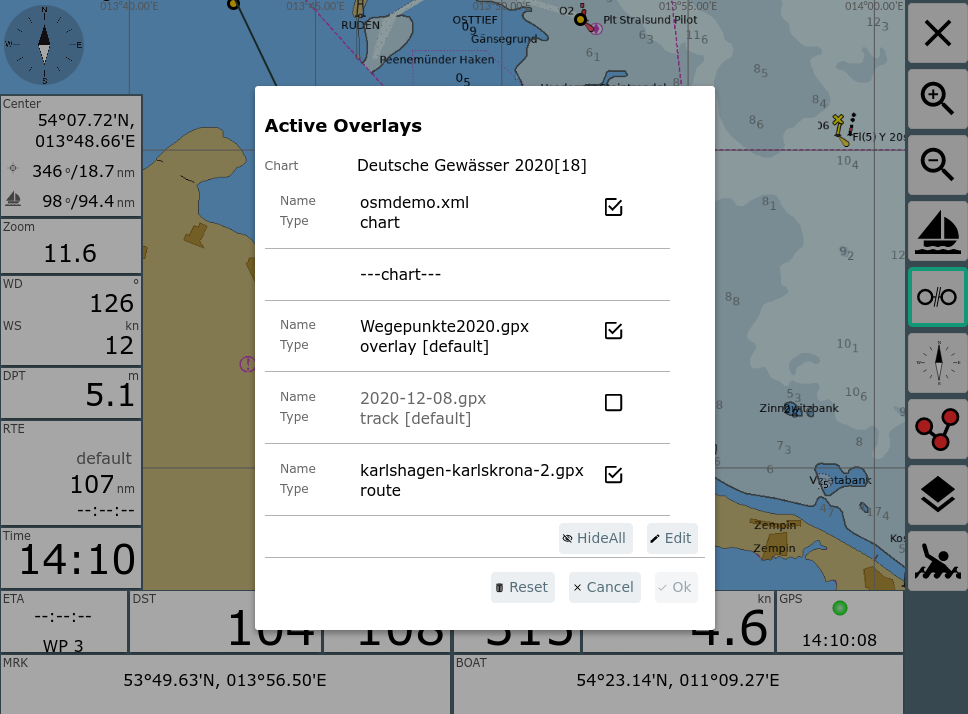
For a chart the overlay configuration looks like:
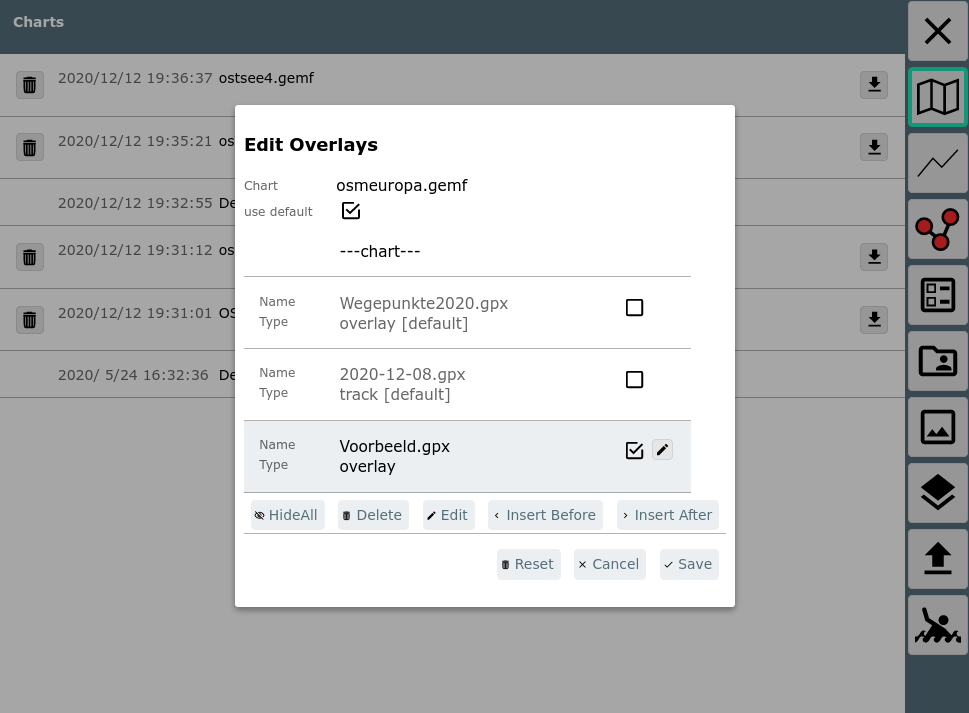
Overlays configured as defaults can only be moved (as a block) or enabled/disabled. The overlays assigned explicitly to the chart can be edited.
You can also access the overlay configuration page from the Mainpage via
the ![]() button
beside each chart.
button
beside each chart.
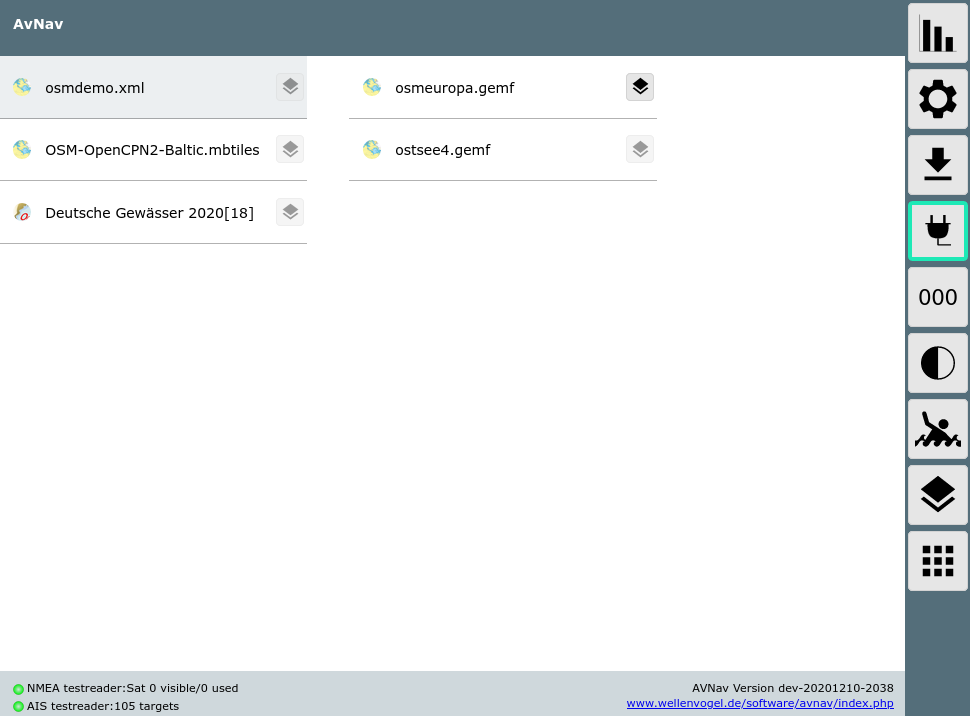
The button on the right side will show the configuration for the default charts.
For tracks and routes you can also invoke overlay configuration directly from a track (gpx file) or a route on the Files/Download page.
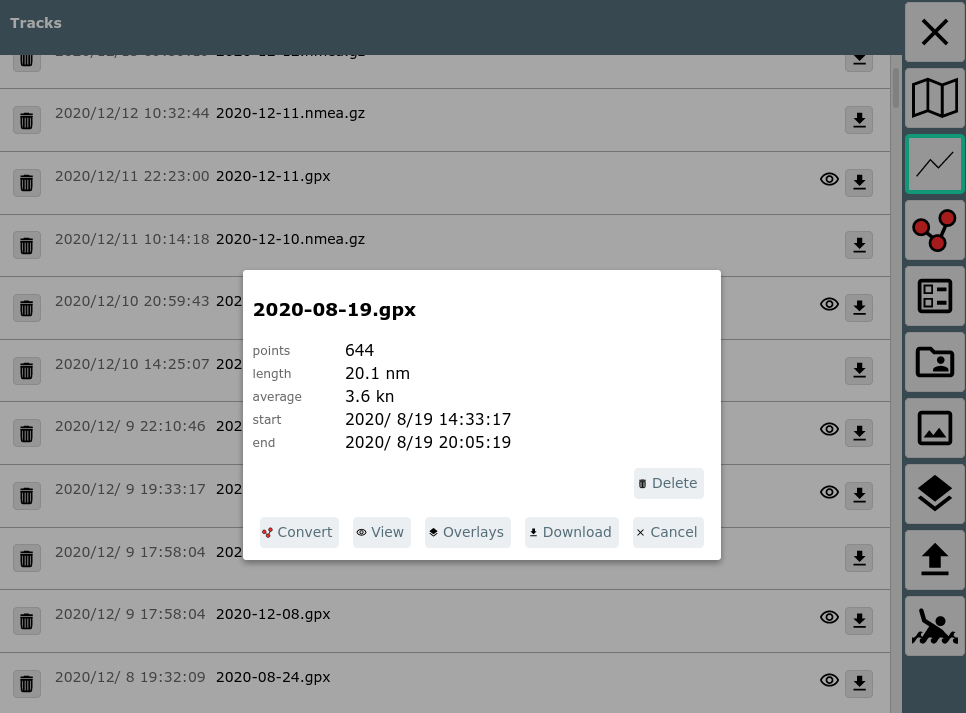
In the picture you see the info dialog that pops up after clicking a gpx track. By selecting "Overlays" you can assign this track to charts (or remove it).
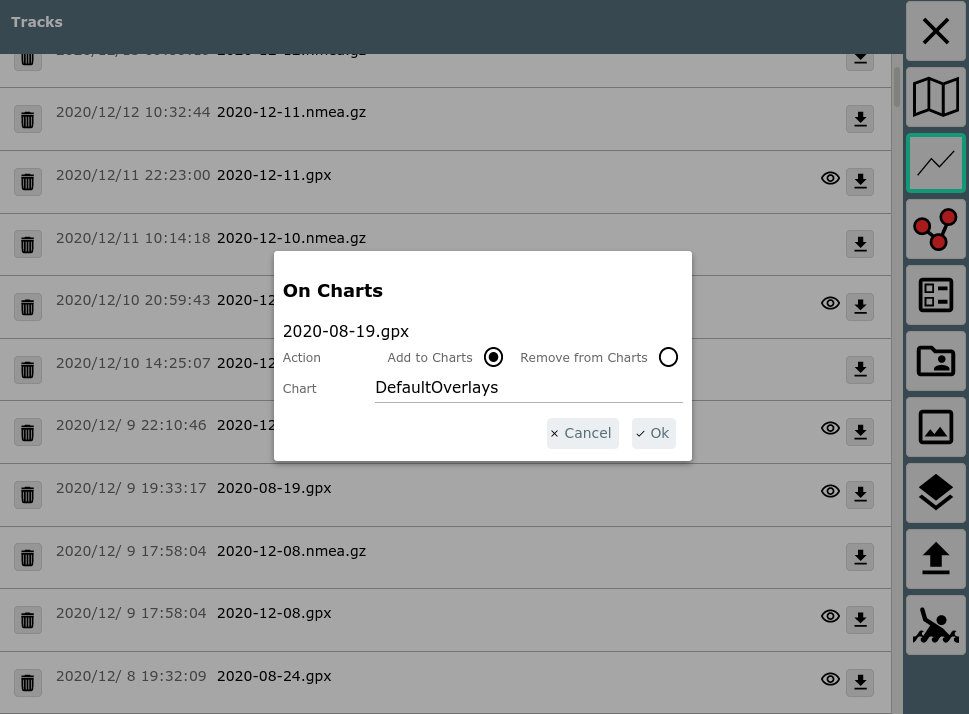
After deciding whether to assign it to the default overlays or to a particular chart, the normal overlay configuration dialog will pop up.
If you select "Remove from Charts" this track will be removed from all overlays.
Usage
A chart selected for display will be shown together with the configured overlays.
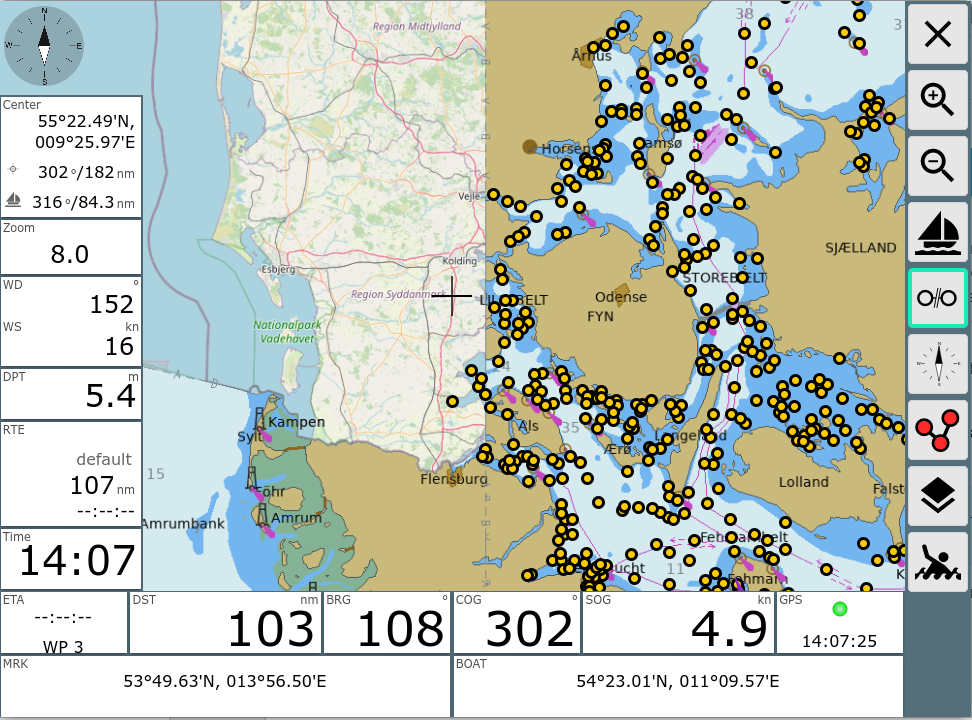
This example shows an o-charts chart together with an OpenStreetMap chart
(below) and a waypoint file on top.
As default icon the --DefaultGpxIcon-- has been selected.
If you click one of the overlay's icons you will get a Feature List with
the overlay included, clicking it brings up the Feature Info dialog.
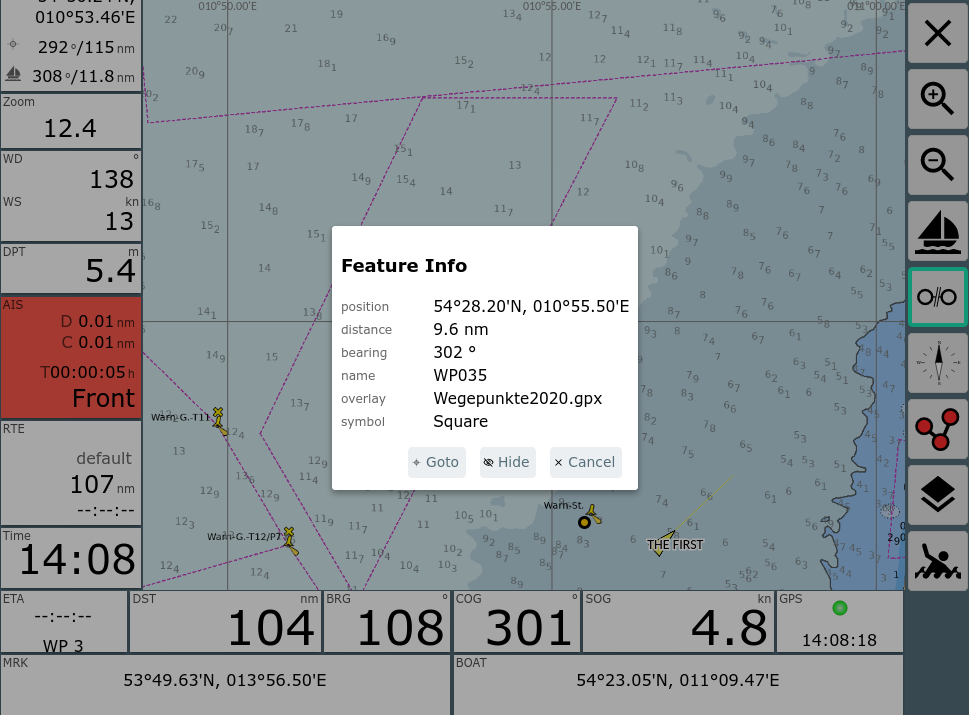
You will see the inforamtion available for this point and you can e.g.
use this point as a routing target immediately (Goto).
Using "Hide" you can temporarily disable the complete overlay.
From within the Route
Editor some more functions are available at the info dialog.
This is done using the ![]() button on the right side.
button on the right side.
The enable and disable settings remain active until you change the chart. They are only valid for your current device (in contrary to all other overlay configuration functions that will always affect all connected devices as they are handled at the server).
By clicking the Edit button you can enter the normal overlay configuration.
Hint:
Using overlay files with a lot of elements can seriously impact the display performance. There is currently no fixed limit for overlay file sizes. Files with several 100MB will for sure lead to problems - 1000 points within an overlay are ok.
Changes of Overlays
Since version 20220225 AvNav will monitor the timestamp of the overlay files and will automatically update the chart display whenever an overlay file changes.
Adaptations
Since version 20210114 you can adapt the information to be extracted from the overlay file and shown at "Feature Info". This could make sense as potentially overlay files contain information that otherwise cannot be handled by AvNav on its own.
For this purpose you can set a "featureFormatter" function when you configure the overlay. This featureFormatter is a java script function, either already built in into AvNav or implemented by you in your user.js It may also be provided by a plugin.
This java script function will retrieve all available parameters of the element from the overlay file that you have clicked on. It can return the properties to be shown in the "Feature Info" dialog.
You can return the following properties:
| Name | Meaning |
| sym | The URL for an icon to be shown. This can be a relative URL referencing an icon file within the configured userIcons file. Alternatively it can be an absolute path like /user/images/myImage.png or an external url starting with http: or https: - this one can only be used with an existing internet connection, of course. |
| name | The name to be displayed |
| desc | The text for the "description" field. |
| htmlInfo | A html string, that will be shown when clicking the |
| time | A time value (string or java script Date) |
| link | An URL, that will be shown when clicking the |
The parameters retrieved by the function depend on the overlay file. Additionally you will always receive "lat" and "lon".
An example for the built in genericHtmlInfo function retrieving all available parameters and writing them into the htmlInfo property as HTML.
The second parameter accepted by this function determines whether to compute all properties or only the "sym" property. If it is set to false you should not execute any time consuming operations, as this function will potentially be called for each of the overlay's elements.
To let AvNav know about your own formatter function you need to register it (see user.js).
After registration you can select this function in overlay configuration.